
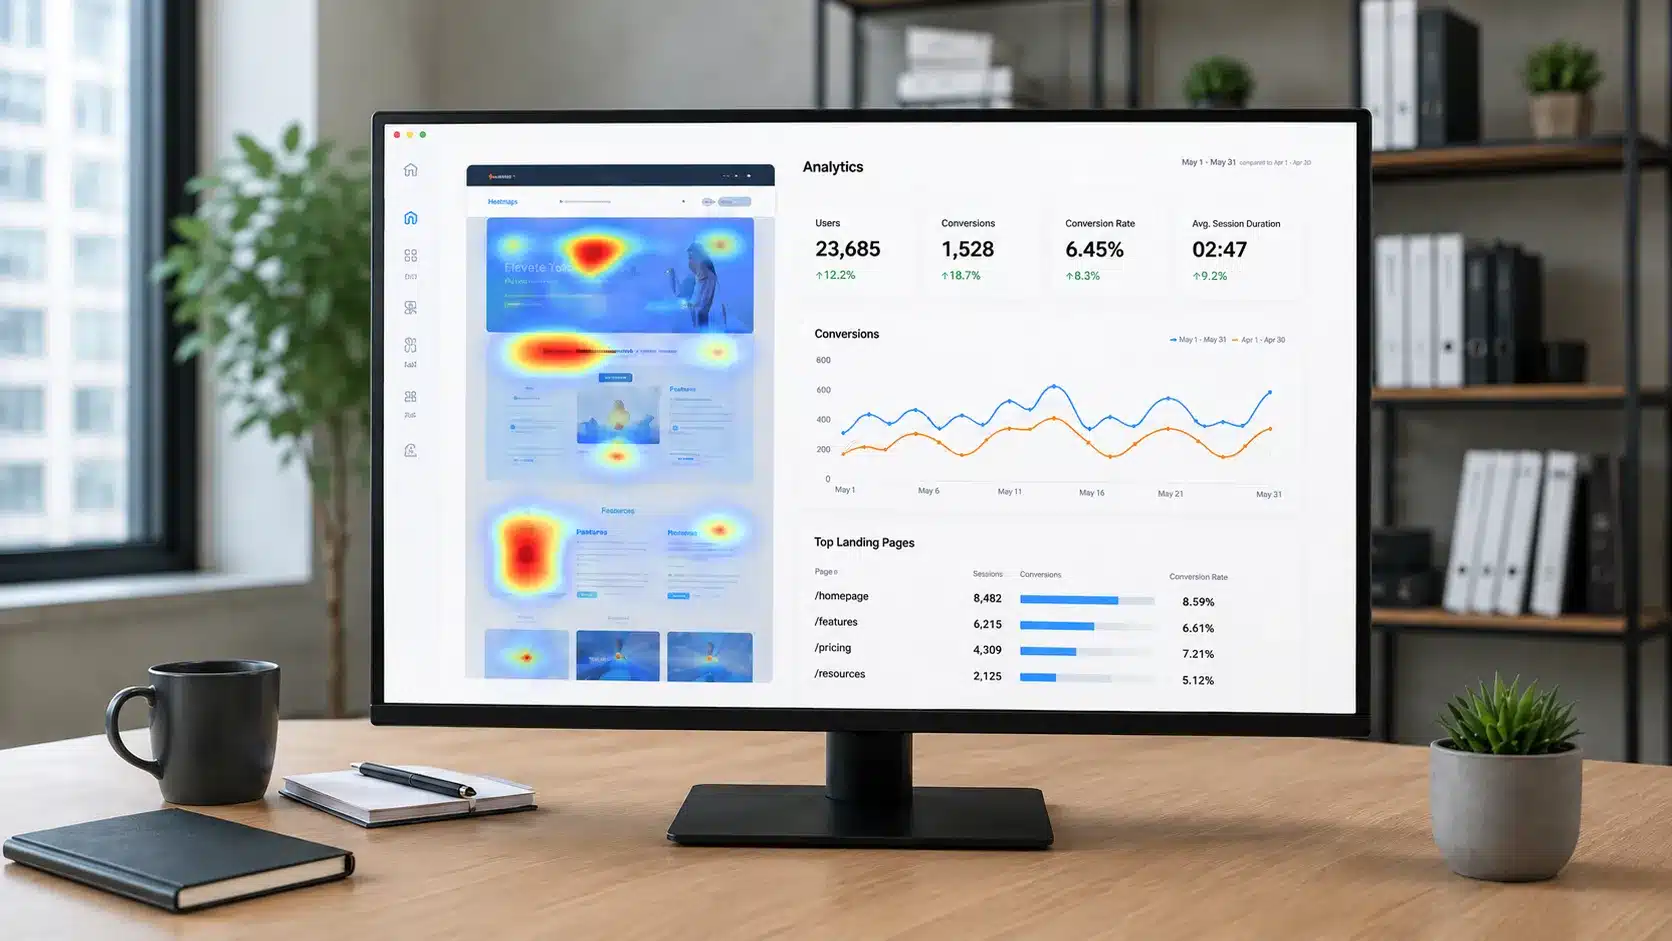
Both heatmaps and analytics tools are standard components of a CRO toolkit. They are not alternatives - they answer different questions about why visitors are or are not converting. Using both together produces a more complete picture than either delivers alone.
What Analytics Tell You
Traditional web analytics - Google Analytics, or equivalent tools - tell you what is happening in quantitative terms. How many people visited the page. Where they came from. How long they spent on it. At what point in a funnel they dropped off. Which pages they visited before converting or leaving.
Analytics is excellent at identifying where the problems are. A high exit rate on a landing page tells you that page is losing visitors. A high drop-off rate at the form step in a checkout or sign-up flow tells you the form is creating friction. These signals point you toward the pages and steps worth investigating further.
What analytics cannot tell you is why those things are happening. It shows you the pattern but not the cause.
What Heatmaps Tell You
Heatmaps visualise visitor behavior on a page - where they click, how far they scroll, and where their mouse moves. They answer the "why" question that analytics raises but cannot answer.
A heatmap on a landing page with a high exit rate might reveal that 80 percent of visitors never scroll below the fold - which tells you the above-fold content is not compelling enough to encourage further reading. Or it might show that visitors are clicking on an image that is not a link, looking for more information that is not there. Or that the CTA button is being ignored while visitors are clicking on secondary links that take them away from the page.
Session recordings take this further - showing the actual mouse and scroll behavior of individual visitors in real time. Watching session recordings of visitors who bounce reveals specific friction points in a way that aggregated data cannot.
Using Both Together
The most effective CRO research process uses analytics to identify which pages have the highest opportunity for improvement, then uses heatmaps and session recordings to understand what is causing the underperformance on those pages. Together they provide both the diagnosis and the direction.
LeadStrong uses this combined approach in its CRO audit process - starting with analytics to prioritize, moving to heatmap and session data to understand, and then developing specific, evidence-based hypotheses for testing.
Frequently Asked Questions
Should I use heatmaps or analytics for CRO?
Both. Analytics identifies where conversion problems are. Heatmaps explain why those problems exist. Using them in combination produces more accurate and actionable CRO insights than either delivers alone.
What heatmap tools are best for CRO?
Hotjar, Microsoft Clarity, and Lucky Orange are widely used and offer heatmaps, scroll maps, and session recordings. Microsoft Clarity is free. Hotjar and Lucky Orange offer more features at tiered pricing.
How do I interpret a heatmap?
Look for where clicks are concentrated - are they on the CTA, or on elements that are not clickable? Look at the scroll map - how far down the page do most visitors reach? And watch session recordings of visitors who bounced - what were they doing before they left?
Ready to use heatmap and analytics data to improve your conversion rates?
Book a free strategy call